ubitricity’s efforts to reduce CO2 emissions
Our journey to cut back emissions
ubitricity stands for “ubiquitous electricity” – because the energy needed for the transformation to electromobility is already available everywhere around us. Since being founded in 2008, ubitricity has been committed to making this energy available to everyone by installing and operating public electric vehicle charge points. Alongside this mission we are continually looking to analyse and improve our own CO2 emmisions.

Our actions
We are highly committed to reducing our environmental footprint. The energy supply of our Berlin headquarter is already C02 neutral, with 100% of the heat demand generated onsite. We have also implemented a climate-friendly business trips policy to reduce CO2. And we operate an ISO 14001:2015 certified environmental management system.
We monitor the main sources of emissions from our operations in Germany, the Netherlands and France. Thanks to our actions to promote a more sustainable business, we have successfully obtained the certificate for the CO2 Performance Ladder Certification* Level 5. You can access our certificate here.
CO₂ Footprint Update for Germany, Netherlands, and France – First Half of 2025 & Mid-Year Trends (2023–2025)
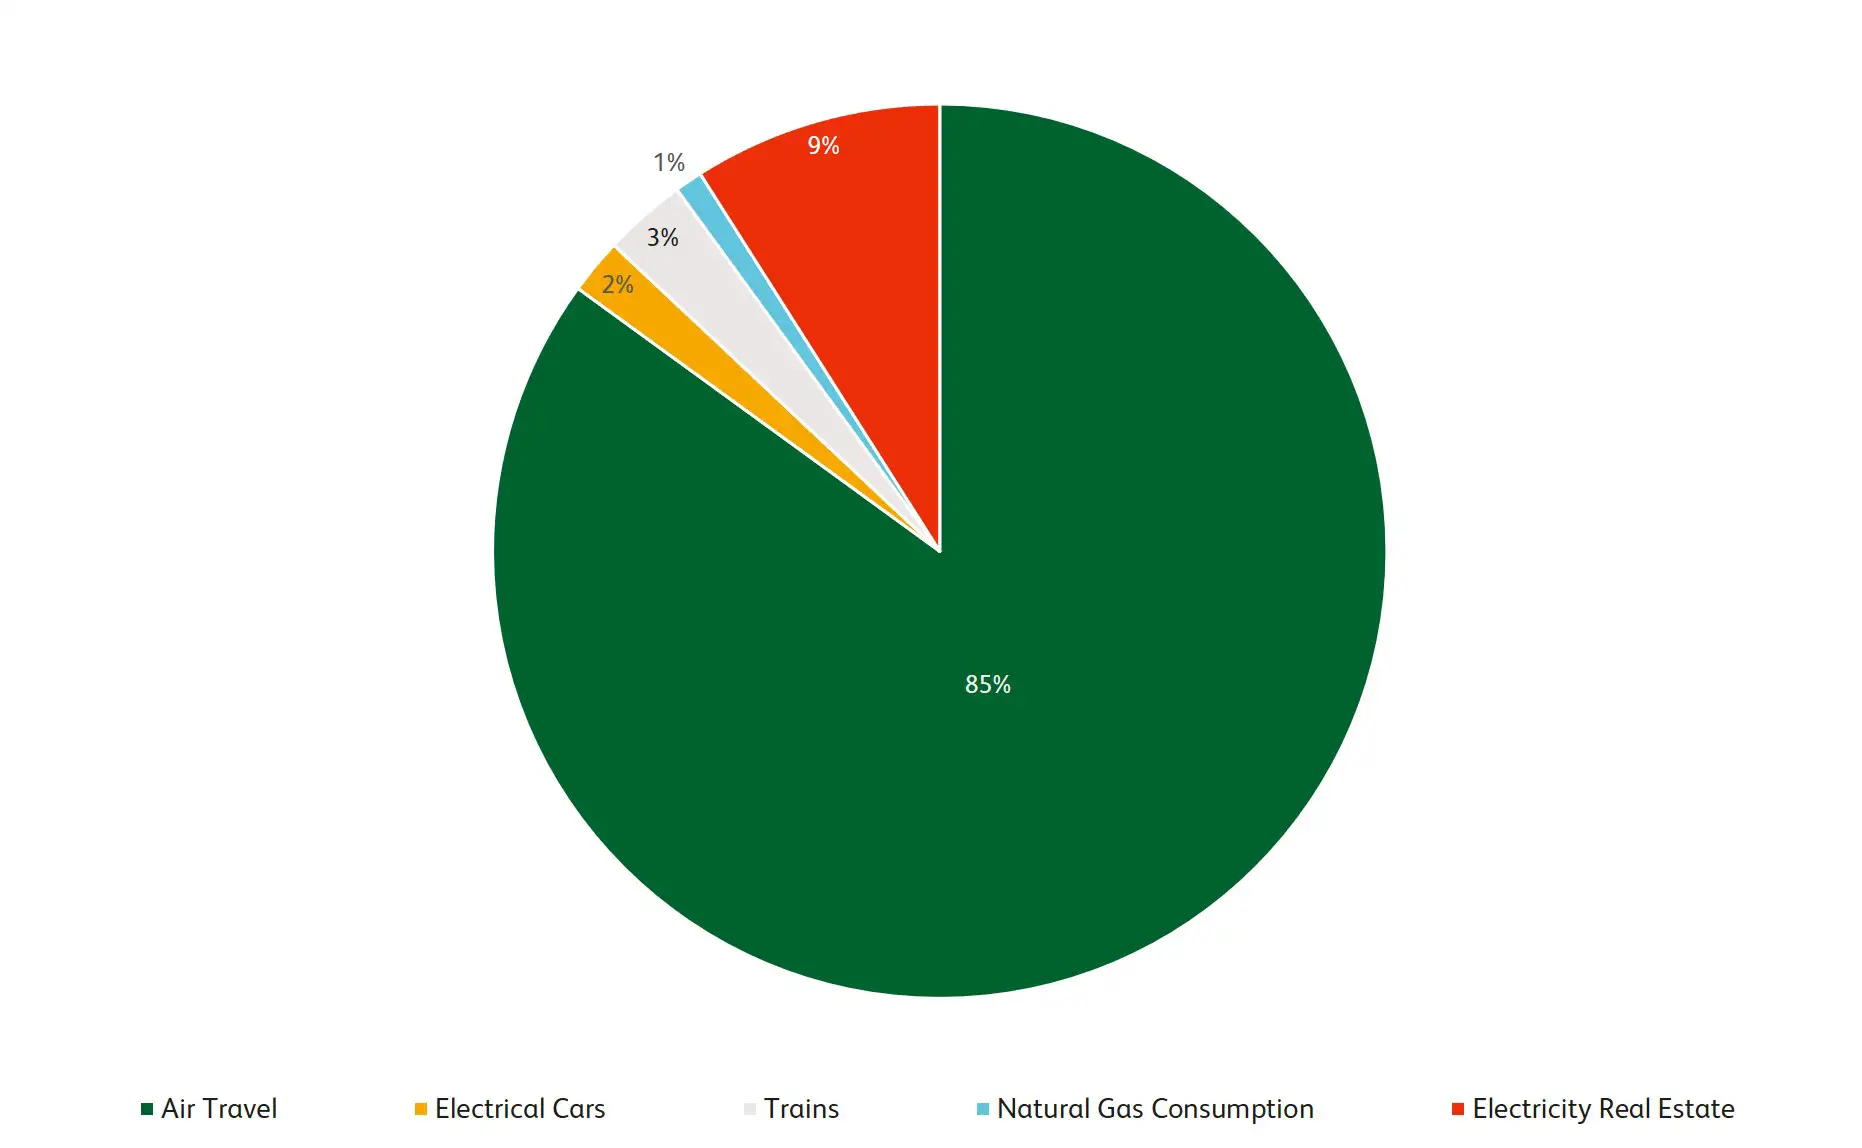
In 2025, our emissions were distributed across various sectors, shown in the corresponding pie chart:

| Reasons for CO2 emissions | 2023 | 2024 | 2025 | Absolut | Relativ FTE-based |
| Air Travel | 20,3 tons | 14,3 tons | 7,9 tons | 61% | 29% |
| Electrical Cars | 0,7 tons | 0,7 tons | 0,2 tons | 71% | 53% |
| Trains | 1,4 tons | 1,1 tons | 0,3 tons | 79% | 65% |
| Natural Gas Consumption | 0,3 tons | 0,3 tons | 0,1 tons | 67% | 45% |
| Electricity | 1,1 tons | 1,3 tons | 0,8 tons | 27% | -20% |
| CO2 emissions in total | 23,8 tons | 17,7 tons | 9,3 tons | – 61% | 32% |
Scope 3 Emissions – Which activities shape our footprint?
By linking turnover to emissions, we identified the most impactful activities across our value chain. This helps us target Scope 3 hotspots and drive smarter sustainability decisions.
| Upstream Scope 3 Emissions | 2023 | 2024 | Progress |
| Purchased goods and services | 2665,8 | 2712,1 | 46,3 |
| Upstream transportation and distribution | 16,5 | 9,8 | -6.7 |
| Employee commuting | 49,1 | 41,2 | -7,9 |
| Total upstream scope 3 emissions (tons) | 2731,4 | 2763,1 | 31,7 |
We implemented the following CO2 reduction and energy saving measures
CO2 Reduction
- We encourage online meetings
- We bundle meetings when an on-site visit is necessary
- We reconsider how many people are needed on a business trip
- We prefer trains instead of planes for domestic travels and international ones up to 700km distance – allowing around 15% of CO2 reduction by 2027 compared with 2023 numbers
Energy Savings
- Especially in summer times: We request all ubitricity employees to turn off fans at the end of the day
- We request all ubitricity employees to turn off all lights when leaving a room
- We request all ubitricity employees to switch off electrical appliances at the end of the day
Initiative Participations
- ubitricity will join the Stichting Positieve Impact to share our best practices and gain insights on other companies’ actions. By that, we aim to exchange knowledge and stimulate innovation related to energy saving and CO2 reduction practices.
Updated Targets for 2027, based on our 2023 baseline
We are adjusting our goals and focusing on fine-tuning and long-term stabilization. To ensure fair and scalable tracking, we’ve shifted to measuring CO₂ emissions per full-time equivalent (FTE). This approach allows us to assess climate performance fairly, consistently, and independently of company growth.
%
2026: Stabilize at max 0,288 tonnes CO2 per FTE (~30% Reduction)
%
2027: Reduce to max 0.267 tonnes CO2 FTE (~35%), focusing on business travel optimization
Title of Chain Analysis: E-mobility Charge Point Operator 2024
What is Chain Analysis?
- A chain analysis involves calculating the CO2 emissions of the entire chain for a particular product or service. The entire chain refers to the entire life cycle of the product: from extraction of the raw material to the end of its lifespan. After our analysis, we came to conclusion that we would carry out the chain analysis of our operational process flow as we identified CO2 reduction opportunities, define reduction targets and monitor the progress.
What is the goal?
- ubitricity will reduce 2% of CO₂ emissions per charging stations YoY, in the chain of new MRA-Elektrisch project from procurement to operations until the end of roll-out period, which is expected to be Q3 of 2027.
Most important measurements:
| Chain steps | Initial | Review | Trend |
| Transport from supplier to location | 0,32 kg | 0,29 kg | -0,03 |
| Transport to Installation Site | 39,5 kg | 21,87 kg | * |
| Process of Installation | 65 kg | 25,91 kg | -39,9 |
| Process of reactive maintenance | 35 kg | 3,20 kg | * |
| Total (kg CO2) | ~139,82 kg | 51,27 kg |
- *Please note that certain chain steps were excluded from the trend analysis, as the underlying calculations were recently corrected. Including them would not provide a representative basis for comparison.
2024 is being established as the reference year, as it reflects the first full and accurate emissions footprint, providing a solid foundation for future comparisons and progress tracking. We are maintaining our 2% year-on-year reduction target, as the updated 2024 dataset provides a solid and trustworthy foundation. The corrections already show that targeted actions are effective—confirming that our goal is both achievable and meaningful.
What is the CO2 performance ladder?
The CO2 Performance Ladder is a CO2 management system that consists of 5 levels. Up to level 3, an organisation that obtains a certificate on the Ladder reduces its own carbon emissions within its activities and projects. From level 4 and 5, the organisation also aims to reduce CO2 emissions on its business chain and sector. An organisation that is certified adheres to the requirements of the CO2 Performance Ladder, based on four angles:
- Insight: To determine different streams of energy and the carbon footprint of the organisation.
- Reduction: To develop ambitious goals for the reduction of CO2 emissions.
- Transparency: To structurally communicate about organisation policies of CO2 reduction.
- Participation: To take part of business sector initiatives with regards to the reduction of carbon emissions.
Downloads
September 2025 – CO2 Performance Ladder update
May 2025 – CO2 Performance Ladder update
September 2024 – CO2 Performance Ladder update
January 2024 – CO2 Performance Ladder update
